Dashboards
Introduction
Note
The current iteration of the dashboard is intended for modelers and hub administrators, who are more likely to be familiar with modeling exercise and evaluation methods.
This is not yet intended for use by decision-makers as there is more information here than they may want or need.
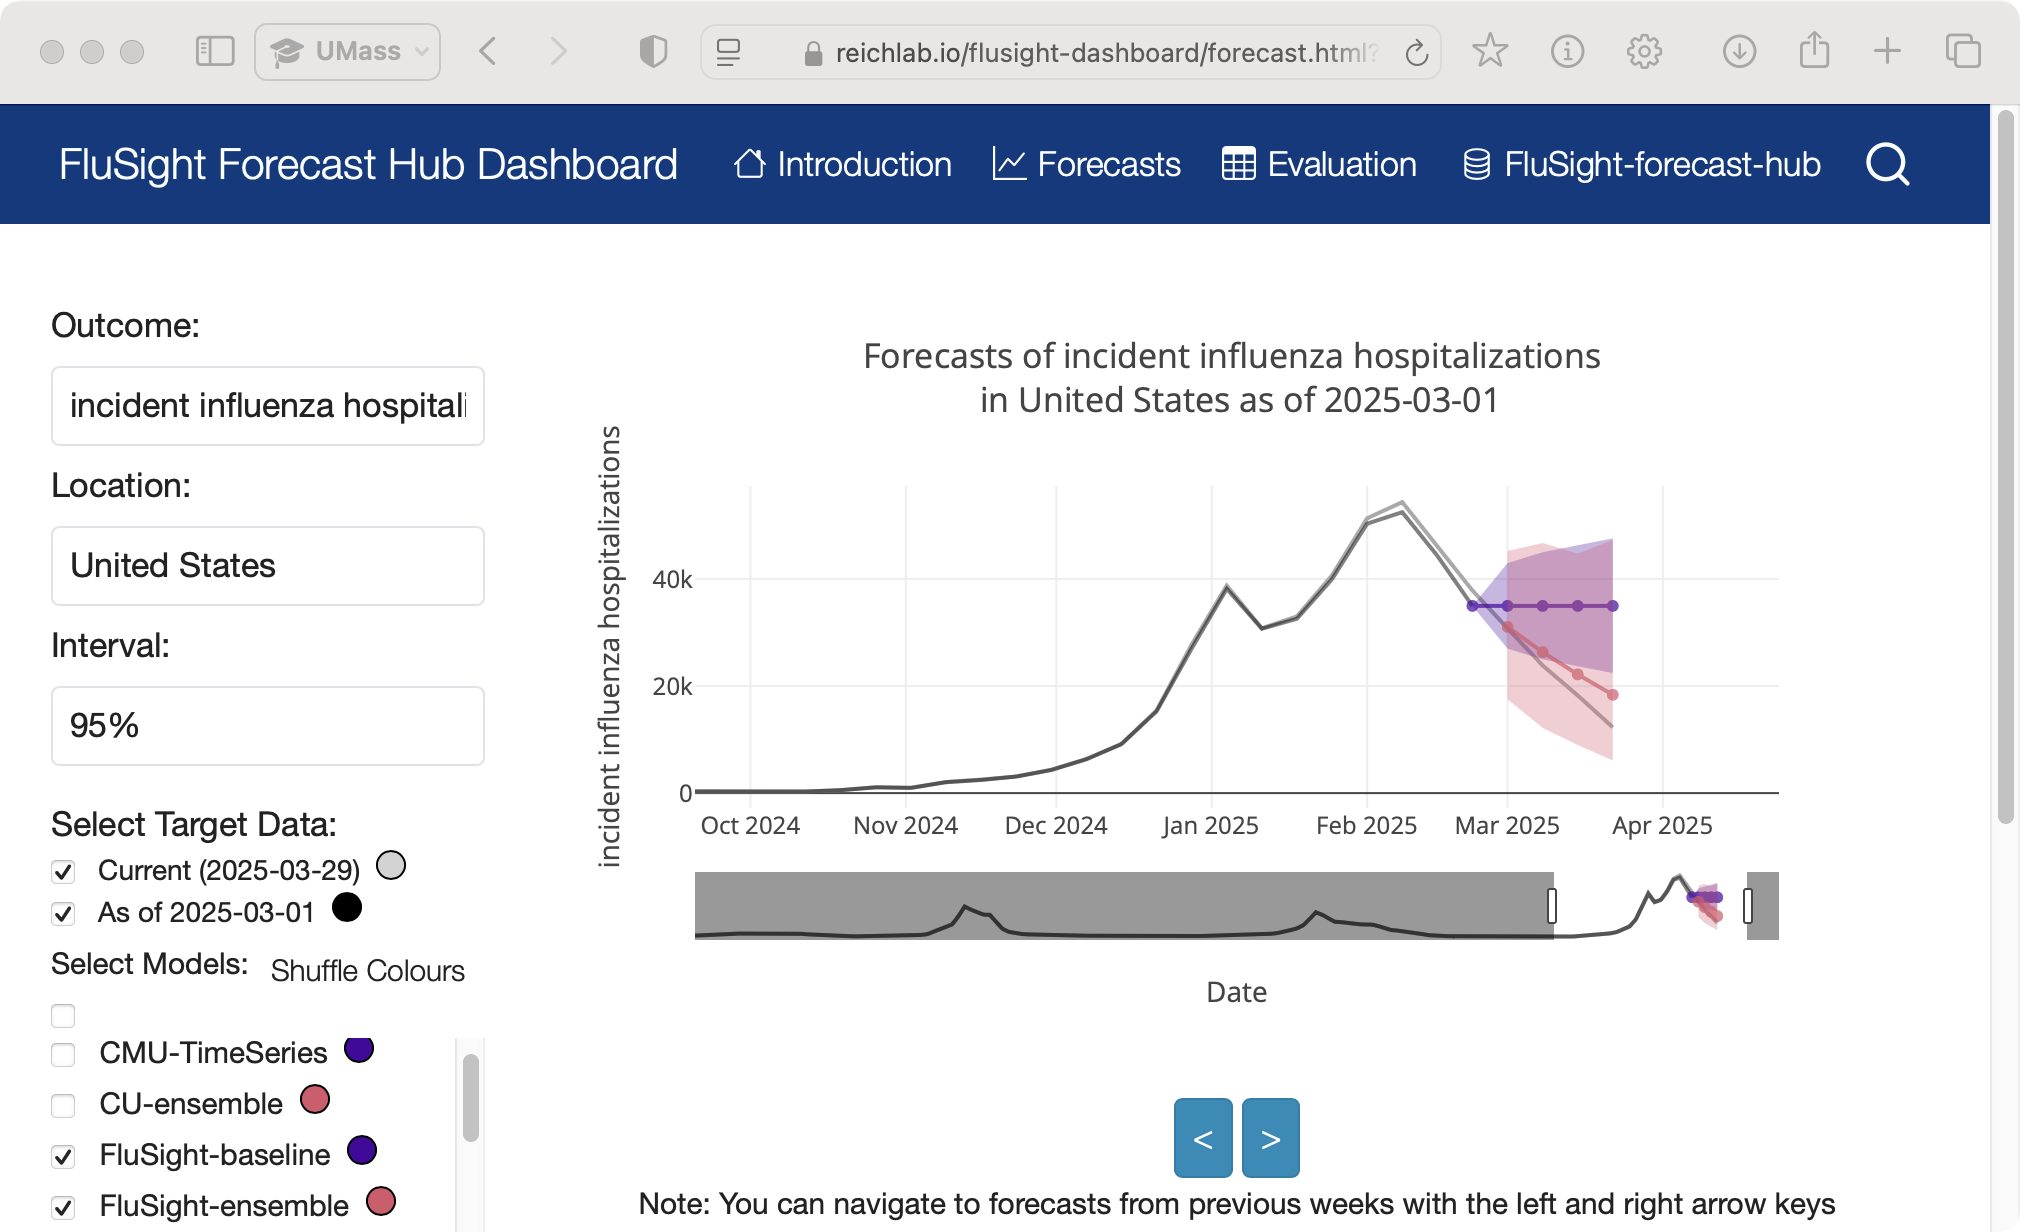
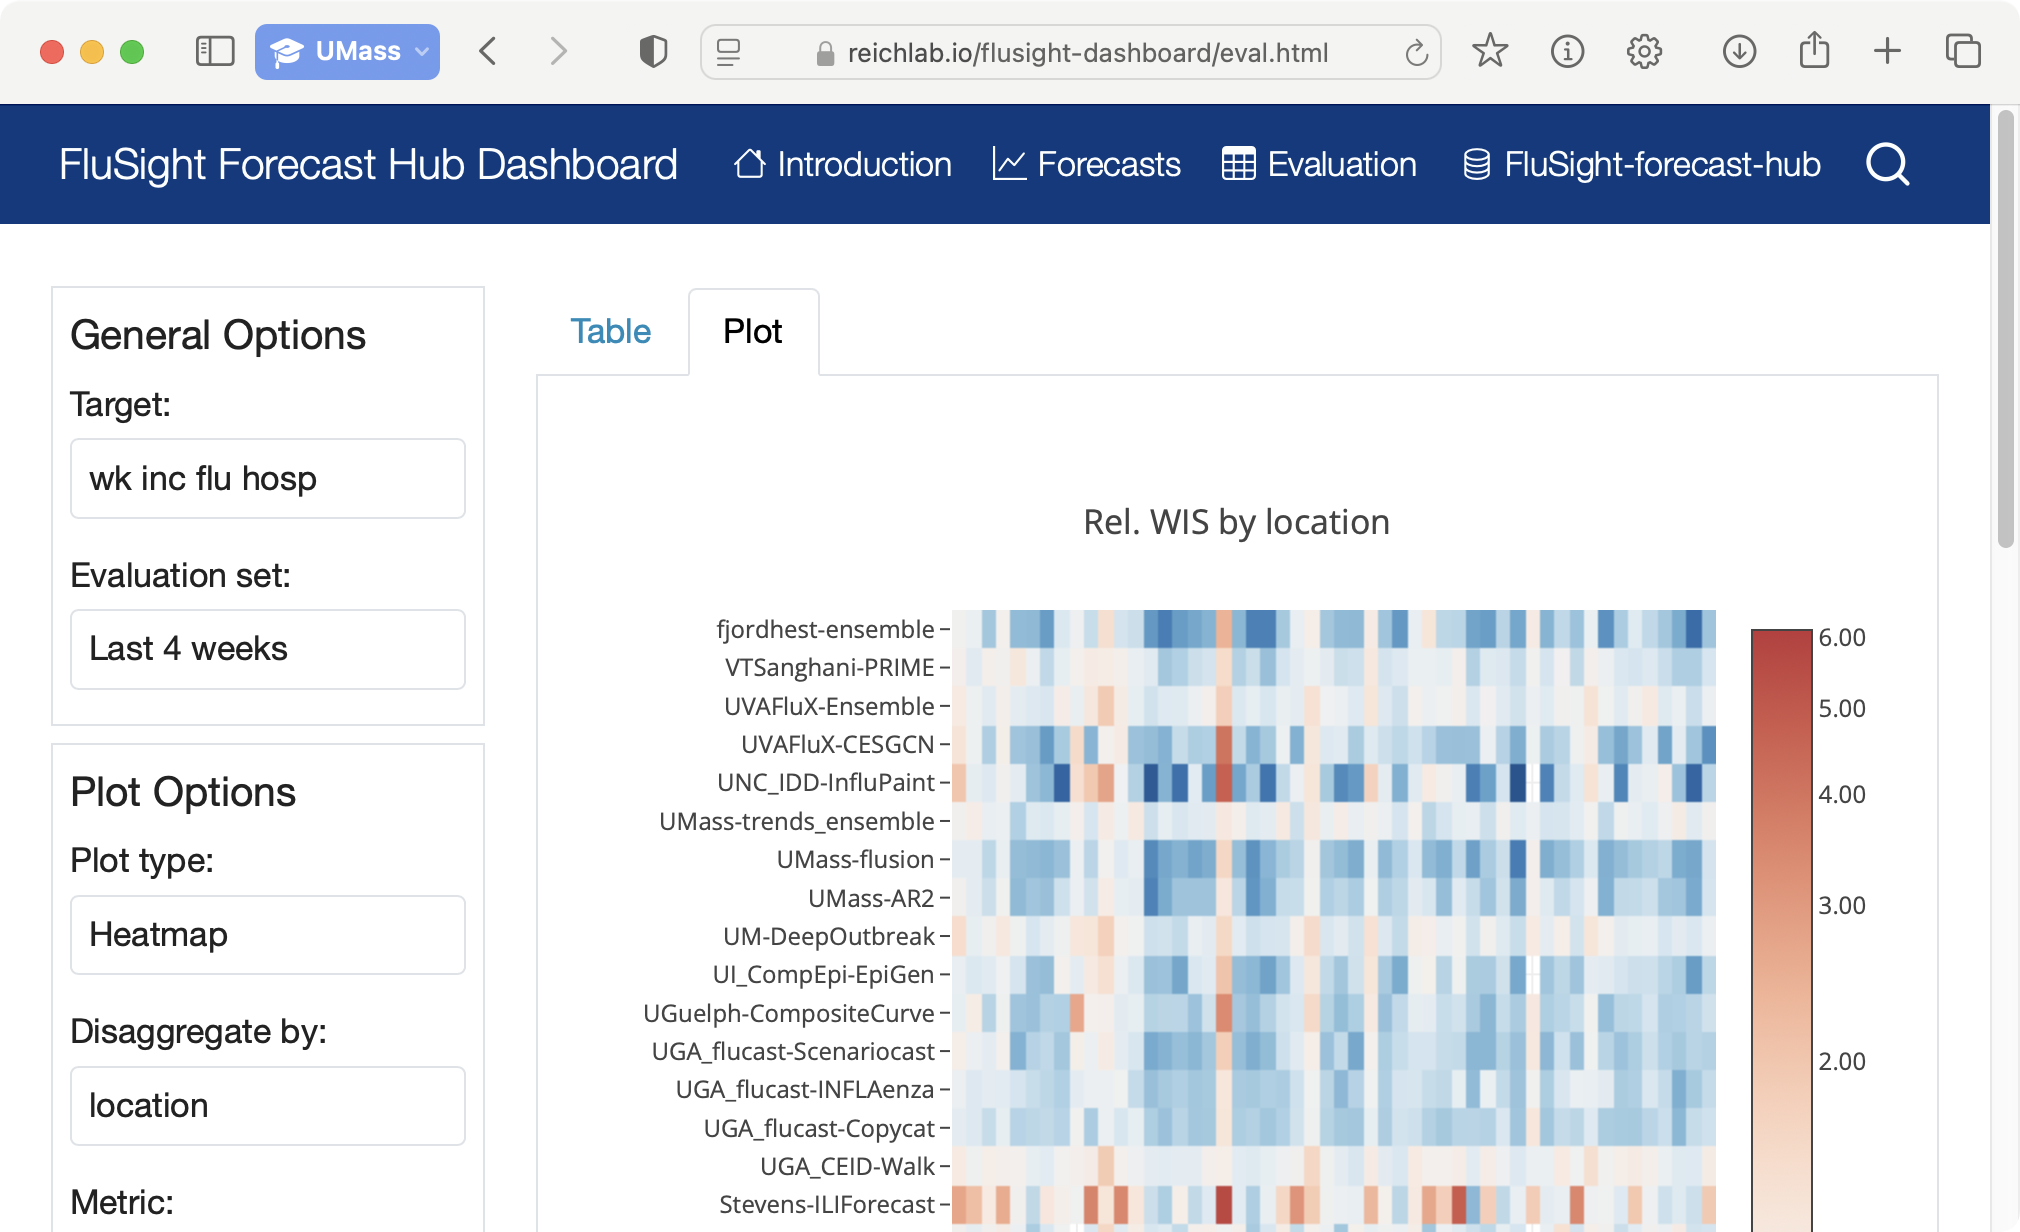
The hubverse dashboard is an expermiental landing page and plug-and-play visualization for hub data. Each dashboard is an independent repository for any given hub.
Examples
Some examples of dashboards are: